

Track Machine Learning Experiments
DagsHub integrates with MLflow to provide an easy way to track experiment parameters and metrics, and provides a built-in integration with Git and dataset management which means all your experiments become fully reproducible.
In this section, we'll learn how to track machine learning experiments on DagsHub with MLflow.
Why track experiments?
Machine Learning and Data Science are fundamentally experimental in nature, as we heavily rely on research and empirical analysis. However, as your project grows in complexity, keeping track of various experiments, their configurations, and results can quickly become overwhelming.
Therefore, tracking the experiment's source, parameters, and results is critical. This helps both in understanding your progress, knowing what approaches work better, and deciding which models to promote to production.
Creating or connecting a project
Each project on DagsHub comes with a full-fledged experiment tracking server based on MLflow and fully compatible with its API. To start you can create a new project or connect an existing GitHub, GitLab, or Bitbucket project.
For the purpose of this guide, let's assume you have your code for training. If you don't, below is a simple code snippet for training a PyTorch Lightning Autoencoder, with a Data Engine Dataset.
Code snippet for autoencoder
Install PyTorch Lightning and DagsHub
pip install lightning
Then use the following code, which should run end-to-end
import os
from torch import optim, nn, utils, Tensor
from torchvision import transforms
import lightning as pl


# define the LightningModule
class LitAutoEncoder(pl.LightningModule):
def __init__(self):
super().__init__()
self.encoder = nn.Sequential(nn.Linear(480 * 640 * 3, 64), nn.ReLU(), nn.Linear(64, 3))
self.decoder = nn.Sequential(nn.Linear(3, 64), nn.ReLU(), nn.Linear(64, 3* 640 * 480))
self.transform = transforms.Resize((480, 640))

    def training_step(self, batch, batch_idx):
        # training_step defines the train loop.
        # it is independent of forward
        x = batch[0]
        if x.shape[1] != 3:
            x = x.expand(-1,3,-1,-1)
        x = self.transform(x)
        x = x.view(x.size(0), -1)
        z = self.encoder(x)
        x_hat = self.decoder(z)
        loss = nn.functional.mse_loss(x_hat, x)
        self.log("train_loss", loss)
        return loss

    def configure_optimizers(self):
        optimizer = optim.Adam(self.parameters(), lr=1e-3)
        return optimizer


# init the autoencoder
autoencoder = LitAutoEncoder()

# setup data
from dagshub.data_engine import datasources
ds = datasources.get('Dean/COCO_1K', 'COCO_1K')
dataset = ds.head().as_ml_dataloader(flavor="torch")

# train the model (hint: here are some helpful Trainer arguments for rapid idea iteration)
trainer = pl.Trainer(limit_train_batches=100, max_epochs=5)
trainer.fit(model=autoencoder, train_dataloaders=dataset)
If you run the snippet above, or your own training loop, it should run end-to-end without errors. Now let's see how to track these experiments with DagsHub.
Instrument MLflow to track experiments
To use MLflow to track the experiments in our project we need to add a couple lines of code. To make the experiments' information accessible outside our local machine, we'll utilize DagsHub hosted MLflow server that comes with your repository. This way you'll be able to share your experiment results with your team or the world!
Setup
Start by installing MLflow and DagsHub:
pip install mlflow dagshub
Next, let's set up the connection and authentication with required to log our experiment to the DagsHub experiment server. We can do this easily with the DagsHub client. Simply run the following line of python (or add it to your script):
import dagshub
dagshub.init(repo_name="<repo-name>", repo_owner="<repo-owner>")
Configure DagsHub from the CLI
You can also configure DagsHub's MLflow tracking server from the CLI. Read more about it in the MLflow integration page
Add MLflow logging
To log the information of the experiment with MLflow we need to add only 3 lines of code to modeling.py
import mlflowwith mlflow.start_run():- “scope” each run in one block of codemlflow.<framework>.autolog()- automatic logging for your framework. Many frameworks are supported out of the box, such as Tensorflow, PyTorch, Scikit Learn and more. You can also manually log parameters and metrics.
After these changes, here is how the snippet from before looks:
Code snippet for autoencoder after MLflow instrumentation
    import os
    from torch import optim, nn, utils, Tensor
    from torchvision import transforms
    import lightning as pl
    import mlflow

    mlflow.autolog()

    # define the LightningModule
    class LitAutoEncoder(pl.LightningModule):
        def __init__(self):
            super().__init__()
            self.encoder = nn.Sequential(nn.Linear(480 * 640 * 3, 64), nn.ReLU(), nn.Linear(64, 3))
            self.decoder = nn.Sequential(nn.Linear(3, 64), nn.ReLU(), nn.Linear(64, 3* 640 * 480))
            self.transform = transforms.Resize((480, 640))

    def training_step(self, batch, batch_idx):
        # training_step defines the train loop.
        # it is independent of forward
        x = batch[0]
        if x.shape[1] != 3:
            x = x.expand(-1,3,-1,-1)
        x = self.transform(x)
        x = x.view(x.size(0), -1)
        z = self.encoder(x)
        x_hat = self.decoder(z)
        loss = nn.functional.mse_loss(x_hat, x)
        self.log("train_loss", loss)
        return loss

    def configure_optimizers(self):
        optimizer = optim.Adam(self.parameters(), lr=1e-3)
        return optimizer

    # init the autoencoder
    autoencoder = LitAutoEncoder()

    # setup data
    from dagshub.data_engine import datasources
    ds = datasources.get('Dean/COCO_1K', 'COCO_1K')
    dataset = ds.head().as_ml_dataloader(flavor="torch")

    with mlflow.start_run():
        # train the model (hint: here are some helpful Trainer arguments for rapid idea iteration)
        trainer = pl.Trainer(limit_train_batches=100, max_epochs=5)
        trainer.fit(model=autoencoder, train_dataloaders=dataset)
MLflow auto-logging
MLflow supports the autologging of many popular frameworks such as PyTorch, Tensorflow, XGBoost and more. You can find all the information here.
Running and logging the experiment
Now, let's rerun the code. Going back to our project we'll see an experiment appear in your experiment tab, that will have parameters, metrics, and even our trained model reported to it.
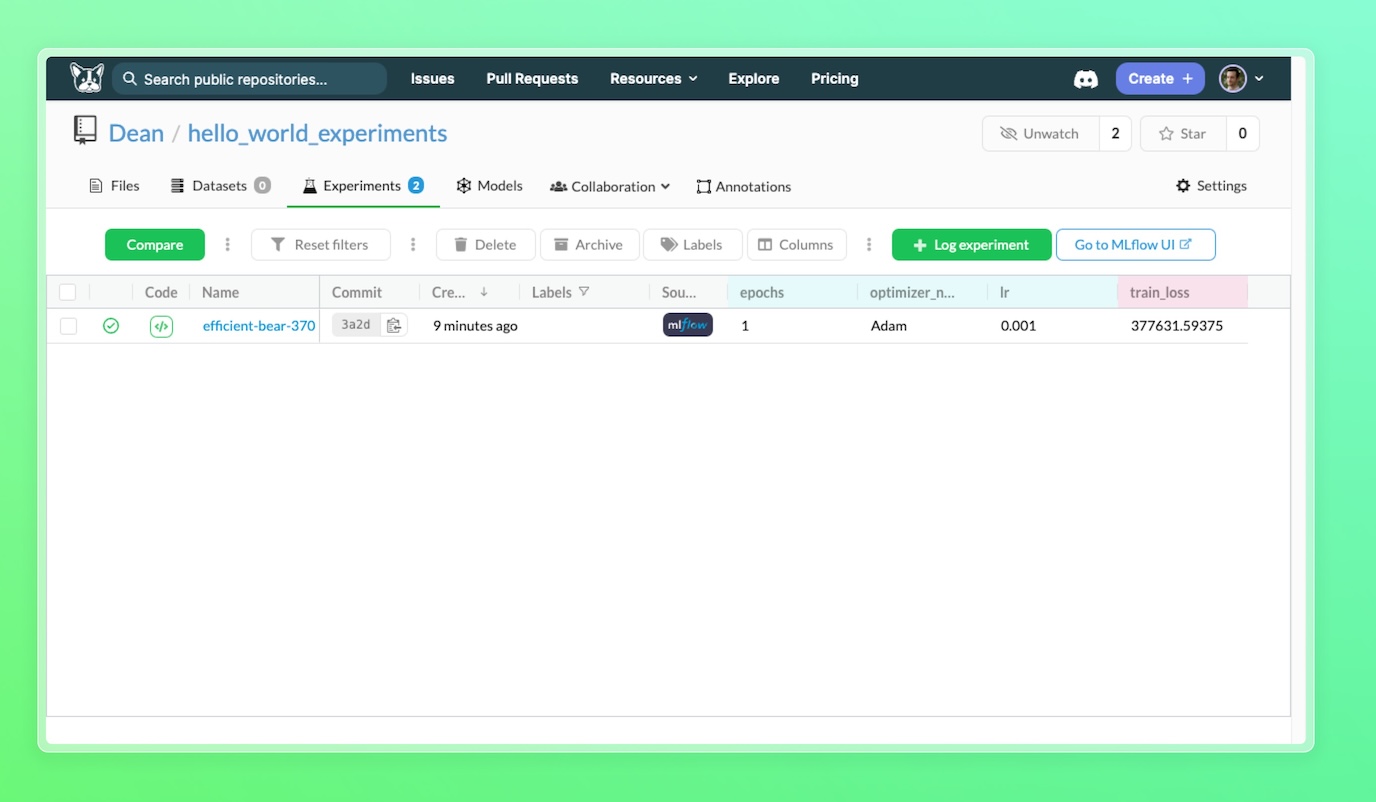
To go into detail and see charts, you can click on the experiment name to go into the single experiment view:
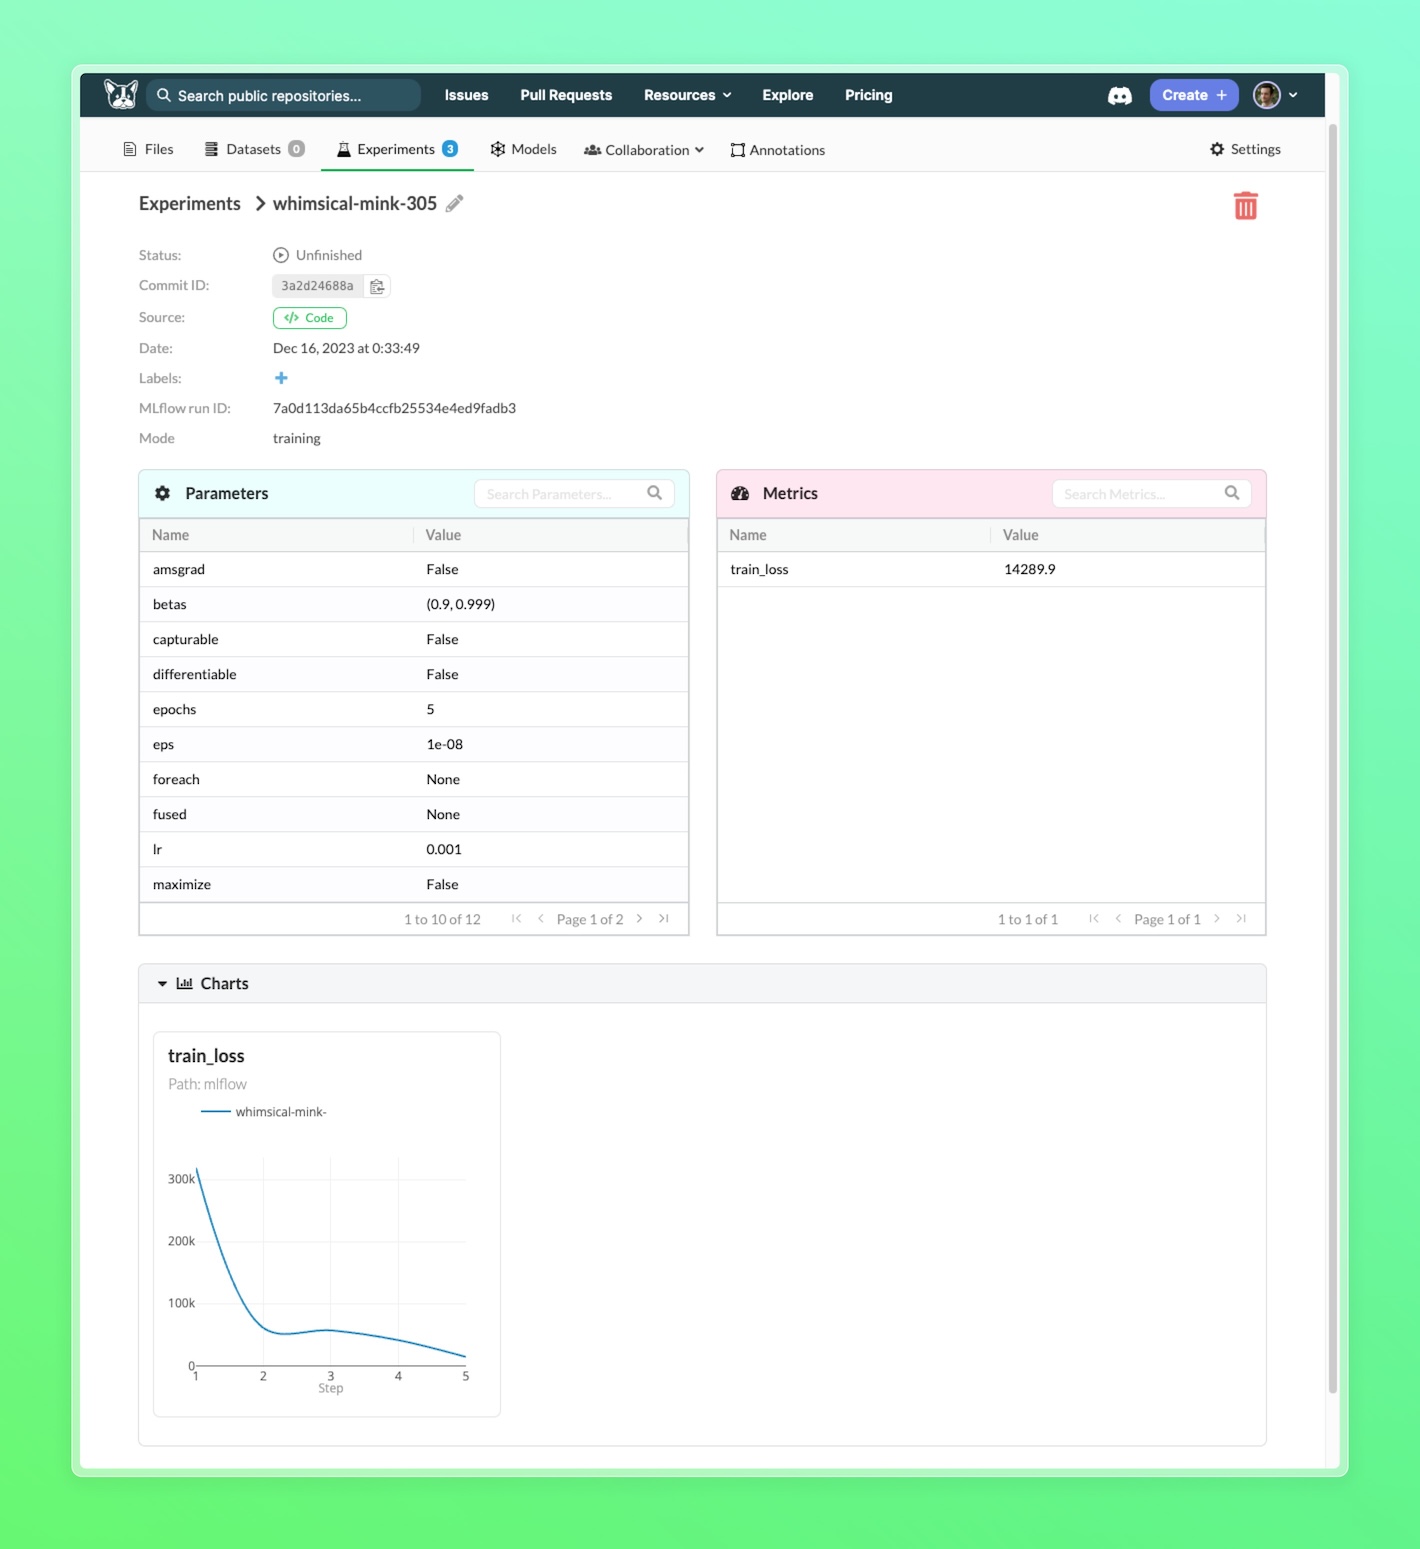
You can also see your experiment in the MLflow UI, including the models and artifacts logged, by clicking on the "Go to MLflow UI button"
Connect a Dataset to your experiment
Dagshub lets you connect your experiment to a dataset.
This way, you can easily find the data used in an MLflow run, and explore it or reuse it for reproduction purposes.
Prerequisites
Basic knowledge of how to use Datasources or Datasets for training models.
Automatic Dataset Tracking
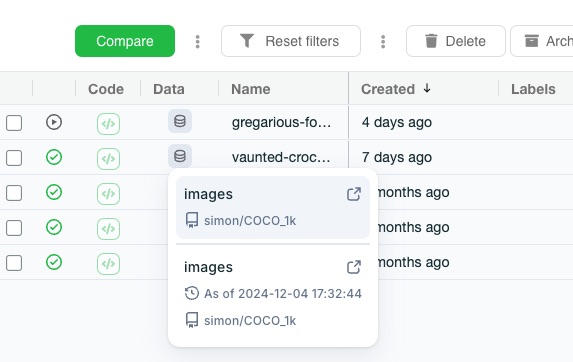
DagsHub automatically tracks the datasets used in your experiments. When you use a DagsHub Dataset while an mlflow run is active, DagsHub will automatically track the dataset version and link it to the experiment. This way, you can always know which dataset was used in a particular experiment.
Code snippet auto logging dataset
    import os
    import mlflow
    ...
    # setup data
    from dagshub.data_engine import datasources
    ds = datasources.get('Dean/COCO_1K', 'COCO_1K')

    with mlflow.start_run():
        # ds.all() will detect the active mlflow run and call ds.log_to_mlflow under the hood
        query_result = ds.all()
        mlflow.log_metric("loss", 0.5)
        # use query_result in your training loop
Manual Dataset Tracking
Sometimes you need to evaluate your dataset before the mlflow run is active. In this case you can manually log the dataset to the mlflow run.
Info
    import os
    import mlflow
    ...
    # setup data
    from dagshub.data_engine import datasources
    ds = datasources.get('Dean/COCO_1K', 'COCO_1K')
    query_result = ds.all()
    query_time = query_result.query_data_time

    with mlflow.start_run():
        # log the dataset to the mlflow run
        ds.log_to_mlflow(as_of=query_time)
        mlflow.log_metric("loss", 0.5)
ds.log_to_mlflow and available arguments see the Client Docs
Next Steps
Now that you have your first experiment run, you can choose what to do next. Learn how to Deploy a model, build an active learning pipeline, or learn how to reproduce experiment results.